Topic 11 · page 21 of 21
Core Practical 9b: results, order and activation energy
A graph of 1 ÷ t against the volume of iodide is a straight line through the origin, so the reaction is first order in iodide. Repeating at different temperatures and plotting ln(1/t) against 1/T gives the activation energy.
Read first: Core Practical 9b: the iodine clock, method, Activation energy from a graph
The results 11.1211.4(i)
Illustrative results for the method on page 20. They are not measured data. The rate is taken as 2.5 × 10⁻⁴ mol dm⁻³ divided by the time.
| KI(aq) / cm³ | [I⁻] / mol dm⁻³ | t / s | 1/t / 10⁻³ s⁻¹ | rate / 10⁻⁶ mol dm⁻³ s⁻¹ |
|---|---|---|---|---|
| 5.0 | 0.010 | 119 | 8.40 | 2.10 |
| 10.0 | 0.020 | 61 | 16.4 | 4.10 |
| 15.0 | 0.030 | 41 | 24.4 | 6.10 |
| 20.0 | 0.040 | 30 | 33.3 | 8.33 |
| 25.0 | 0.050 | 24 | 41.7 | 10.4 |
The order with respect to iodide 11.5(iii)
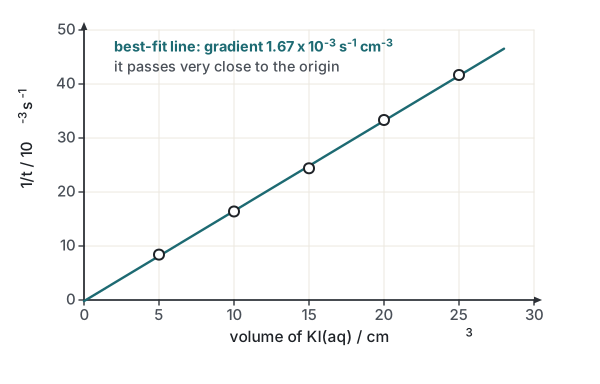
Rate is proportional to 1/t, so plot 1/t on the y axis. Because the total volume is constant, the concentration of iodide is proportional to the volume of potassium iodide solution, so the volume can go on the x axis in place of concentration.
Worked exampleOrder from the table
- Experiments 1 and 2: the volume (and so [I⁻]) doubles, and 1/t rises from 8.40 to 16.4, a factor of 1.95. The rate is about ×2.
- Experiments 1 and 4: [I⁻] is ×4, and 1/t rises from 8.40 to 33.3, a factor of 3.97. The rate is about ×4.
- The graph is a straight line through the origin, so the rate is directly proportional to [I⁻]: the reaction is first order with respect to iodide.
- Rate ÷ [I⁻] is almost constant: 2.1 × 10⁻⁴, 2.05 × 10⁻⁴, 2.03 × 10⁻⁴, 2.08 × 10⁻⁴ and 2.08 × 10⁻⁴ s⁻¹. This constant includes k and the fixed concentrations of the other reagents.
If you plotted t against volume you would get a curve (a time that halves when the volume doubles), which is hard to interpret. Plotting 1/t gives a straight line.
To find the orders for the other reagents, repeat the experiment changing the volume of that reagent only, with water making up the total volume to 50.0 cm³.
The activation energy 11.1211.10
Repeat the experiment with the same volumes (10.0 cm³ of KI) at four temperatures, with all the reagents warmed or cooled in a water bath before mixing. Because the concentrations are the same each time, 1/t is proportional to k.
| Temperature / °C | T / K | 1/T / 10⁻³ K⁻¹ | t / s | ln(1/t) |
|---|---|---|---|---|
| 15 | 288 | 3.472 | 118 | −4.771 |
| 25 | 298 | 3.356 | 61 | −4.111 |
| 35 | 308 | 3.247 | 33 | −3.497 |
| 45 | 318 | 3.145 | 18 | −2.890 |
The graph of ln(1/t) against 1/T is a straight line, as on page 15. The line of best fit passes through (3.15, −2.93) and (3.45, −4.65).
Worked exampleActivation energy from the clock
- Δy = −4.65 − (−2.93) = −1.72
- Δx = (3.45 − 3.15) × 10⁻³ = 0.30 × 10⁻³ K⁻¹
- gradient = −1.72 ÷ 0.30 × 10⁻³ = −5.73 × 10³ K
- = 5.73 × 10³ × 8.31 = 4.76 × 10⁴ J mol⁻¹
- = 47.6 kJ mol⁻¹
A quick check with only the end values, 288 K and 318 K, using the two-temperature equation from page 16: the ratio of the times is 118 ÷ 18 = 6.56, so ln 6.56 = 1.880. Then 1/288 − 1/318 = 3.276 × 10⁻⁴ K⁻¹ and = 8.31 × 1.880 ÷ 3.276 × 10⁻⁴ = 4.77 × 10⁴ J mol⁻¹, which is 47.7 kJ mol⁻¹. The two methods agree.
Evaluating the experiment 11.12
| Source of error | Effect | Improvement |
|---|---|---|
| Judging the first appearance of the blue-black colour | an error of about 1 s: 5.6% of an 18 s run but 0.8% of a 118 s run | use a colorimeter, or have the same person judge each time against white paper |
| Reagents not at the temperature of the bath when mixed | the temperature of the run is not the one recorded | warm or cool each solution in the bath first and check the temperature at the end |
| Hydrogen peroxide solution that has partly decomposed | its concentration is less than stated, so every time is long | use a fresh solution, and the same bottle throughout |
| One run per condition | a random error is not averaged out | repeat each and take the mean |
| The clock only approximates the initial rate | small systematic error | use a small amount of thiosulfate (1.25% of the peroxide is used) |
Check yourself
- Calculate 1/t for the experiments with t = 61 s and t = 24 s, in s⁻¹.
- In an iodine clock the time falls from 61 s to 30 s when the volume of KI is doubled from 10.0 to 20.0 cm³ (total volume constant). Deduce the order with respect to iodide.
- Explain why a graph of t against the volume of KI is a curve and not a straight line.
- Use the data at 298 K (61 s) and 308 K (33 s) to calculate .
- A stopwatch is started and stopped with an uncertainty of about 1 s. Calculate the percentage uncertainty for a time of 18 s and for a time of 118 s.
- A student plots ln t against 1/T and gets a gradient of +5.73 × 10³ K. Explain how this relates to the activation energy.
Answers cover these until you have tried the questions
- 1/61 = 0.0164 s⁻¹ (1.64 × 10⁻²) and 1/24 = 0.0417 s⁻¹ (4.17 × 10⁻²).
- 1/t rises from 1/61 = 0.0164 to 1/30 = 0.0333, a factor of 2.03, so the rate approximately doubles when [I⁻] doubles. The reaction is first order with respect to iodide.
- The rate is proportional to the volume (so to [I⁻]), and t is proportional to 1 ÷ rate, so t is inversely proportional to the volume. That is a curve, a hyperbola. A graph of 1/t is the straight line.
- ln(t₁ ÷ t₂) = ln(61 ÷ 33) = 0.6144 (the rate ratio is the inverse of the time ratio). 1/298 − 1/308 = 1.0895 × 10⁻⁴ K⁻¹. = 8.31 × 0.6144 ÷ 1.0895 × 10⁻⁴ = 4.69 × 10⁴ J mol⁻¹ = 46.9 kJ mol⁻¹.
- 1 ÷ 18 × 100 = 5.6%. 1 ÷ 118 × 100 = 0.85%.
- ln t = −ln(1/t), so a plot of ln t against 1/T is the same line turned upside down and has the opposite gradient, +/R. The activation energy is the gradient × R = 5.73 × 10³ × 8.31 = 4.76 × 10⁴ J mol⁻¹ = 47.6 kJ mol⁻¹.