Topic 11 · page 19 of 21
Core Practical 9a: results and evaluation
Titre against time is a straight line, so the rate does not depend on the iodine concentration and the reaction is zero order in iodine. Repeating with more propanone or more acid shows each is first order.
Read first: Core Practical 9a: iodine and propanone by titration, method, Orders from concentration–time graphs
The results 11.1211.5(i)
Illustrative results for the standard run of page 18. These are not measured data.
| Time of quench / min | Titre of 0.0100 mol dm⁻³ Na₂S₂O₃ / cm³ | [I₂] / 10⁻³ mol dm⁻³ |
|---|---|---|
| 4 | 8.6 | 4.30 |
| 8 | 7.2 | 3.60 |
| 12 | 5.7 | 2.85 |
| 16 | 4.2 | 2.10 |
| 20 | 2.8 | 1.40 |
| 24 | 1.4 | 0.70 |
The titre is proportional to the iodine concentration. From the first titre calculation, 10.0 cm³ corresponds to 0.00500 mol dm⁻³, so [I₂] = titre × 5.00 × 10⁻⁴ mol dm⁻³ per cm³.
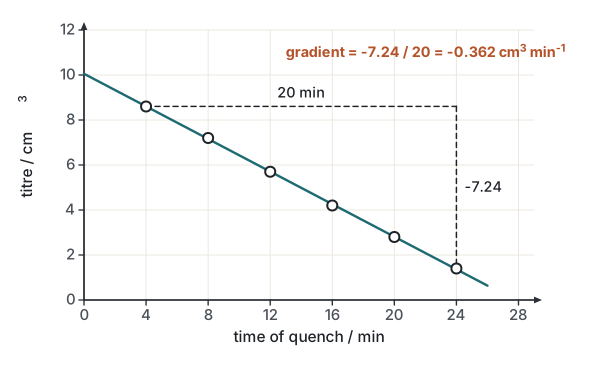
Reading the graph 11.5(i)11.6(ii)
Compare this with page 8. If iodine were first order, the graph would be a curve with constant half-lives. If it were second order, the half-lives would double. Neither is seen.
This is the evidence for a prediction on page 11: iodine is not in the rate-determining step.
The rate and the other orders 11.6(i)
The rate is the size of the gradient, converted from cm³ of titre per minute to mol dm⁻³ s⁻¹.
Worked exampleRate from the gradient
Use the triangle on the graph: (4 min, 8.60 cm³) to (24 min, 1.36 cm³).
- gradient = (1.36 − 8.60) ÷ (24 − 4) = −7.24 ÷ 20 = −0.362 cm³ min⁻¹
- Convert titre to concentration: 0.362 × 5.00 × 10⁻⁴ = 1.81 × 10⁻⁴ mol dm⁻³ min⁻¹
- Convert minutes to seconds: 1.81 × 10⁻⁴ ÷ 60 = 3.0 × 10⁻⁶
- Rate = 3.0 × 10⁻⁶ mol dm⁻³ s⁻¹
Because iodine is zero order, this rate is constant through the run and is the rate for the starting concentrations of propanone (0.250 mol dm⁻³) and H⁺ (0.500 mol dm⁻³).
Two more experiments change one concentration each. Each is a straight line, and the gradients give the rates (illustrative values).
| Run | [CH₃COCH₃] / mol dm⁻³ | [H⁺] / mol dm⁻³ | Gradient / cm³ min⁻¹ | Rate / 10⁻⁶ mol dm⁻³ s⁻¹ |
|---|---|---|---|---|
| A (standard) | 0.250 | 0.500 | 0.36 | 3.0 |
| B (50.0 cm³ propanone, no water) | 0.500 | 0.500 | 0.72 | 6.0 |
| C (50.0 cm³ H₂SO₄, no water) | 0.250 | 1.00 | 0.72 | 6.0 |
Worked exampleOrders for propanone and acid
- A and B: [propanone] ×2, rate ×2: first order in propanone.
- A and C: [H⁺] ×2, rate ×2: first order in H⁺.
- rate = k[CH₃COCH₃][H⁺]. Using run A: k = 3.0 × 10⁻⁶ ÷ (0.250 × 0.500) = 3.0 × 10⁻⁶ ÷ 0.125 = 2.4 × 10⁻⁵ dm³ mol⁻¹ s⁻¹.
Evaluating the experiment 11.12
| Source of error | Effect | Improvement |
|---|---|---|
| Delay in quenching, or time noted at the end of the titration | the time is wrong, so points are shifted | swirl and note the time as the pipette empties |
| Burette reading uncertainty of about ±0.10 cm³ for two readings | a 7% uncertainty in the smallest titres, 1.4 cm³ | use more sample, or a more dilute thiosulfate, so that titres are larger |
| Temperature not constant | k and so the gradient change | use a water bath |
| Starch added early | end point unclear | add it only when the solution is pale yellow |
| Propanone and acid are not truly constant | graph curves very slightly | they change by only 2%, so this is small |
A sound answer also says what the data do show. The points lie close to the line and the intercept is 10.05 cm³, which is almost exactly the 10.0 cm³ calculated for the starting concentration. That agreement is good evidence that the experiment was done correctly.
Check yourself
- State the order with respect to iodine in this experiment and give the evidence.
- A straight line on a titre–time graph has a gradient of −0.45 cm³ min⁻¹. Calculate the rate in mol dm⁻³ s⁻¹, using 1 cm³ of titre = 5.00 × 10⁻⁴ mol dm⁻³ of I₂.
- The titre of a sample is 6.0 cm³. Calculate [I₂] in the sample.
- In a second run with twice the concentration of propanone, the gradient of the titre–time graph is twice as steep. State the order with respect to propanone.
- The burette readings have an uncertainty of ±0.05 cm³ each, so a titre has an uncertainty of ±0.10 cm³. Calculate the percentage uncertainty in a titre of 1.4 cm³ and suggest an improvement.
- If iodine were first order, what would the shape of the titre–time graph be, and how would you confirm the order from it?
Answers cover these until you have tried the questions
- Zero order. The titre against time is a straight line, so the rate is constant while [I₂] falls. The rate does not depend on [I₂].
- 0.45 × 5.00 × 10⁻⁴ = 2.25 × 10⁻⁴ mol dm⁻³ min⁻¹. Divide by 60: 3.8 × 10⁻⁶ mol dm⁻³ s⁻¹.
- [I₂] = 6.0 × 5.00 × 10⁻⁴ = 3.0 × 10⁻³ mol dm⁻³.
- Doubling [propanone] doubles the rate, so the reaction is first order with respect to propanone.
- 0.10 ÷ 1.4 × 100 = 7.1%. Use a larger sample volume, or a more dilute thiosulfate, so that the titres are larger and the uncertainty is a smaller percentage.
- A curve that flattens. To confirm first order, measure successive half-lives from the curve. If they are constant, the order is 1.