Topic 2 · page 9 of 15
First ionisation energy of elements 1 to 36
Plot the first ionisation energy of the first 36 elements and the same pattern repeats after each noble gas. That repeat defines a periodic property, and the small dips inside each period are evidence for sub-shells.
Read first: Ionisation energy, Successive ionisation energies
Plotting first ionisation energy against atomic number 2.17
The second piece of evidence for electron structure comes from the first ionisation energies of different elements, one after another. Here is the whole set for hydrogen to krypton (kJ mol⁻¹).
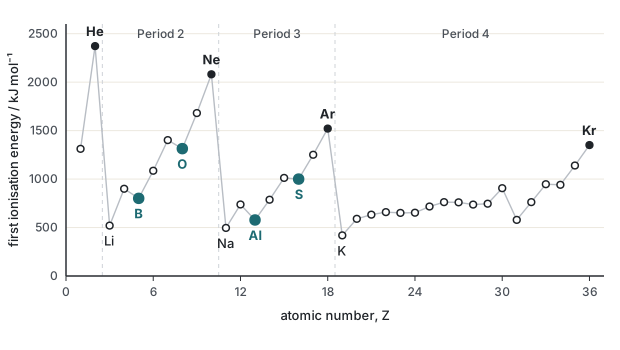
To draw a graph like this from a table of data:
- Put atomic number on the horizontal axis. It is the independent variable and the elements follow in order.
- Put first ionisation energy (kJ mol⁻¹) on the vertical axis. Choose a scale that uses more than half of the grid. Label the axes with both quantity and unit.
- Mark each point clearly with a small cross, then join the points with straight lines to show the pattern.
Read the pattern from left to right:
- The first ionisation energy rises across a period to a peak at the noble gas (He, Ne, Ar, Kr).
- It falls sharply at the start of the next period, to a low at the Group 1 element (Li, Na, K).
- Then it rises again, and the next period repeats the shape.
Logarithms on a graph 2.17
Sometimes the data covers a huge range, as for successive ionisation energies. Then you plot the logarithm of each value. For first ionisation energies the range is much smaller, but the specification still asks you to draw this graph with logs, so here is the method.
MethodPlotting lg (first ionisation energy)
- For each value, press the log button on your calculator and note the answer to 3 decimal places. The first ionisation energy of neon is 2081 kJ mol⁻¹, so lg 2081 = 3.318.
- Draw a vertical axis for lg (ionisation energy / kJ mol⁻¹). The values here run from 2.622 (potassium) to 3.375 (helium), so a scale from 2.5 to 3.5 suits the grid. Use a broken-axis mark or a clear label to show that the axis does not start at zero.
- Plot lg against atomic number and join the points, as before.
| Element | Li | Be | B | C | N | O | F | Ne |
|---|---|---|---|---|---|---|---|---|
| IE / kJ mol⁻¹ | 520 | 900 | 801 | 1086 | 1402 | 1314 | 1681 | 2081 |
| lg (IE / kJ mol⁻¹) | 2.716 | 2.954 | 2.904 | 3.036 | 3.147 | 3.119 | 3.226 | 3.318 |
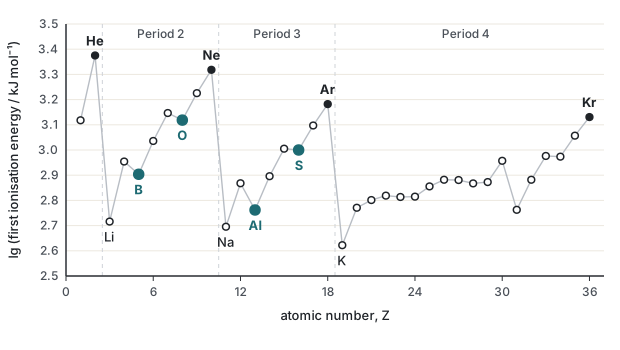
The two graphs have the same shape. A logarithm does not change which values are larger. It squeezes a wide range into a narrow one, which is why it is used for data such as successive ionisation energies, where the values differ by factors of 1000.
A periodic property 2.17
The pattern of the first ionisation energy repeats from Period 2, to Period 3, to Period 4. Each period starts with a low value at Group 1 and ends with a high value at a noble gas. First ionisation energy is therefore a periodic property. The repeating pattern is called periodicity.
The pattern repeats because the electronic structure repeats. Each new period starts a new shell with one electron, which is easy to remove, and ends by filling that shell, which gives the noble gases. Filling the orbitals builds this up in detail.
The dips: evidence for sub-shells 2.11(ii)
Look at Period 2 on the graph. The first ionisation energy generally rises, because the nuclear charge grows while the new electrons go into the same shell. But it does not rise smoothly. There are two small falls:
- from Be to B (900 to 801 kJ mol⁻¹)
- from N to O (1402 to 1314 kJ mol⁻¹)
The same two dips appear in Period 3: Mg to Al (738 to 578) and P to S (1012 to 1000). Because they occur at the same positions in both periods, they are not accidents. They have to come from how the electrons are arranged.
If a shell were a single energy level, with all of its electrons at the same energy, the first ionisation energy would rise steadily across a period. The dips show that the shell is divided into sub-shells at different energies:
- The first two electrons (Li, Be) are in a lower-energy sub-shell. The fifth electron (B) goes into a higher-energy one, so it is easier to remove. That makes the first dip.
- The next sub-shell fills over six elements (B to Ne). The dip at O shows something happens after three electrons have been added, which is explained when you meet orbitals.
Check yourself
- Calculate lg (ionisation energy / kJ mol⁻¹) for sodium (496) and for helium (2372), to 3 decimal places.
- Name the elements at the three highest peaks of the graph and at the three lowest troughs among the first 20 elements.
- Define the term periodic property and use the first ionisation energy graph to show that it applies.
- Give two reasons for plotting lg of an ionisation energy rather than the value itself.
- Describe, with figures, the dip in first ionisation energy between nitrogen and oxygen.
- What do the dips at boron and oxygen suggest about the structure of the second shell?
Answers cover these until you have tried the questions
- lg 496 = 2.695. lg 2372 = 3.375.
- Highest: helium (2372), neon (2081) and argon (1521). Lowest among the first 20: potassium (419), sodium (496) and lithium (520).
- A periodic property is a property that shows a repeating pattern when plotted against atomic number. The first ionisation energy rises to a peak at each noble gas (He, Ne, Ar, Kr) and falls to a low at each Group 1 element (Li, Na, K). The same pattern occurs in each period.
- A logarithm compresses a wide range of values so that all points fit on one axis, and it makes proportional changes clearer. It is essential for successive ionisation energies, which differ by factors of 1000.
- The first ionisation energy rises from carbon (1086) to nitrogen (1402), then falls to oxygen (1314), a drop of 88 kJ mol⁻¹, before rising again to fluorine (1681).
- If shells were single energy levels, there would be no dips. The dips show that the second shell is split into sub-shells: two electrons in a lower-energy sub-shell, then six in a higher-energy sub-shell, within which something changes after the third electron.