Topic 9 · page 6 of 15
The Maxwell–Boltzmann distribution
The molecules in a sample do not all have the same energy. The Maxwell–Boltzmann curve shows how many have each energy, and the area beyond the activation energy shows how many can react.
Read first: Collisions and activation energy
Molecules have a spread of energies 9.4
In a gas at one temperature, the molecules do not all move at the same speed. Collisions constantly pass energy between them, so some molecules have very little energy, a few have a great deal, and most are somewhere in between. The average energy depends on the temperature, but the energies of individual molecules are spread out.
The Maxwell–Boltzmann distribution is a graph of that spread. The horizontal axis is energy. The vertical axis is the number of molecules with that energy.
Reading the curve 9.4
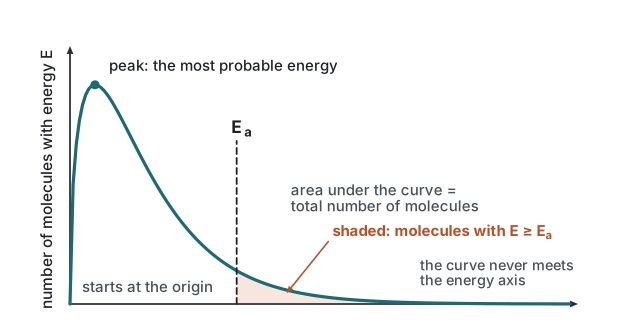
Each feature has a meaning:
- It starts at the origin. No molecules have zero energy.
- It rises to a peak. The peak is the most probable energy: more molecules have this energy than any other.
- It has a long tail on the right. A few molecules have much more energy than average. The curve is not symmetrical.
- It never touches the energy axis. There is no upper limit to the energy a molecule can have, so the curve gets closer and closer to the axis but never meets it.
- The area under the curve is the total number of molecules. The area does not change unless molecules are added or removed.
- The area to the right of is the number of molecules with energy greater than or equal to . These are the molecules that can react when they collide.
The activation energy on the graph 9.29.4
The activation energy is drawn as a vertical line at a fixed position on the energy axis. Everything to the right of the line is "enough energy". The shaded area is a small part of the whole area, which is why most collisions fail.
MethodDrawing the curve in an exam
- Label the axes: energy (horizontal) and number of molecules (vertical).
- Start the curve at the origin.
- Rise to a single peak at low energy, then fall away gradually with a long tail.
- Let the tail approach the energy axis without touching it, and never turn upwards again.
- Draw a vertical line for to the right of the peak, and shade the area to its right.
Check yourself
- State two features of a Maxwell–Boltzmann distribution curve, one at the origin and one at high energy.
- What does the area under the whole curve represent?
- What does the area to the right of the activation energy represent?
- Explain why the curve does not touch the energy axis.
- State what you must label on a Maxwell–Boltzmann sketch for a question about activation energy.
- A student draws a symmetrical bell-shaped curve that starts on the energy axis at a positive energy and touches the energy axis again at high energy. Give three things wrong with it.
Answers cover these until you have tried the questions
- At the origin: the curve starts at the origin (no molecules have zero energy). At high energy: the curve gets close to the energy axis but never touches it, with a long tail. (Also acceptable: it has a single peak, which is the most probable energy.)
- The total number of molecules in the sample.
- The number of molecules with energy greater than or equal to the activation energy, the molecules that can react on collision.
- There is no maximum energy a molecule can have, so there is always a very small number of molecules with any large energy.
- Both axes (energy; number of molecules), the activation energy as a vertical line, and the shaded area to the right of it.
- It is symmetrical, but the real curve has a long tail on the right. It does not start at the origin: it should start at zero energy and zero molecules. It touches the energy axis at high energy, but the real curve approaches the axis without ever meeting it.